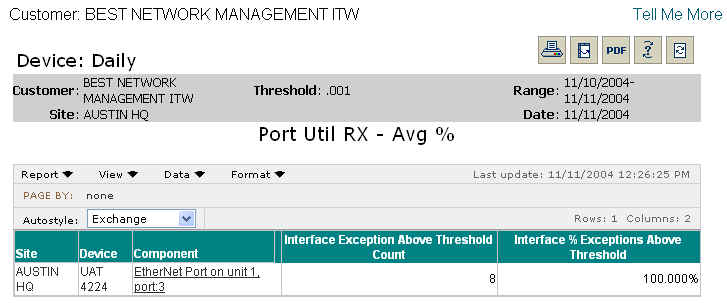
The Device: Daily report provides a table view of the number of 15-minute data values above your specified threshold for a single attribute from a specific element over the past rolling 24 hours. The purpose of the Device: Daily report is to allow you to generate self-service exception reports containing the element type, attribute, and threshold of your choosing.
You, your IT manager, or networking expert can use this report to pinpoint the devices in your network that are experiencing high exceptions. High exceptions can be opportunities for you to upgrade or downgrade hardware, software, or bandwidth.
Report Example:

To run a Device: Daily report:
Select the Reports tab.
From the Available Reports categories, select Exceptions > Device: Daily.
From the network tree, select and click the appropriate device.
Select a performance metric.
Select an upper threshold value.
Click Continue.
NOTE: You will see a message screen that shows the time until the report results
are complete. To exit the results page and send the report to the Stored Reports
page for later viewing, click Send to Stored Reports.
When viewing the report, you will see a grid containing the following information:
Site
Device
Component
Interface Exceptions Above Threshold Count
Interface % Exception Above Threshold
NOTE: By clicking an individual Component link, you can go directly to the Performance: Daily report where you can see a graph of the component's performance.
For information on different ways to display and/or print report output, see Report Options.
Related topics:
Device Type: Monthly Low Exceptions