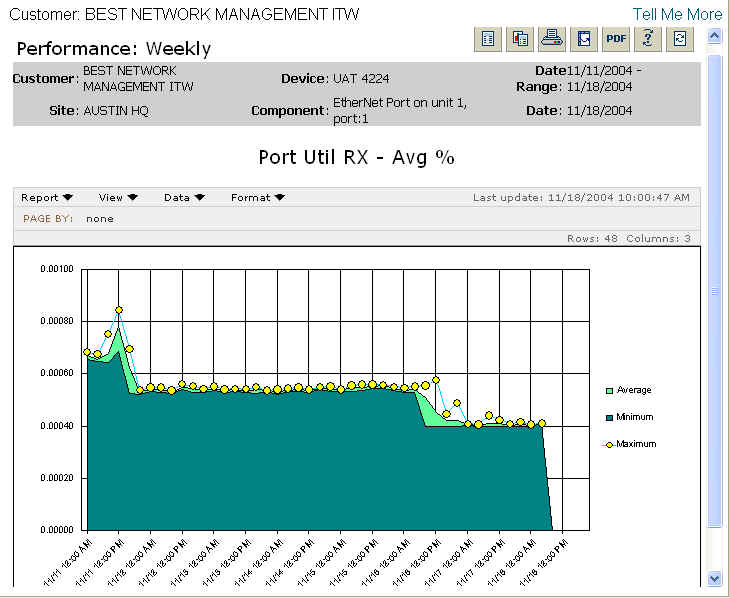
The Performance: Weekly report provides a graphical view of the previous seven calendar days of 4-hour aggregate values (min, max, and average). You can click on a single 4-hour data point and drill down to a 4-hour graph of 15-minute aggregate values (min, max, and average). The purpose of the report is to allow you to generate self-service attribute reports containing the element and attribute of your choosing.
Report Example:

To run a Performance: Weekly report:
Select the Reports tab.
From the Available Reports categories, select Analysis > Performance: Weekly.
From the network tree, select and click the appropriate device.
From the Available list, select the component to include in the report, and click the arrow to transfer the information into the Selected list.
NOTE: You also have the option to search for a component by typing a component name into the Search for field and clicking the Magnifying Glass icon. You can choose to match cases by checking or un-checking the Match case checkbox.
Click Continue.
Select an attribute.
Click Continue.
NOTE: You will see a message screen that shows the time until the report results
are complete. To exit the results page and send the report to the Stored Reports
page for later viewing, click Send to Stored Reports.
When viewing the report, you will see a graph containing information matching the options you selected.
For information on different ways to display and/or print report output, see Report Options.
Related topics: