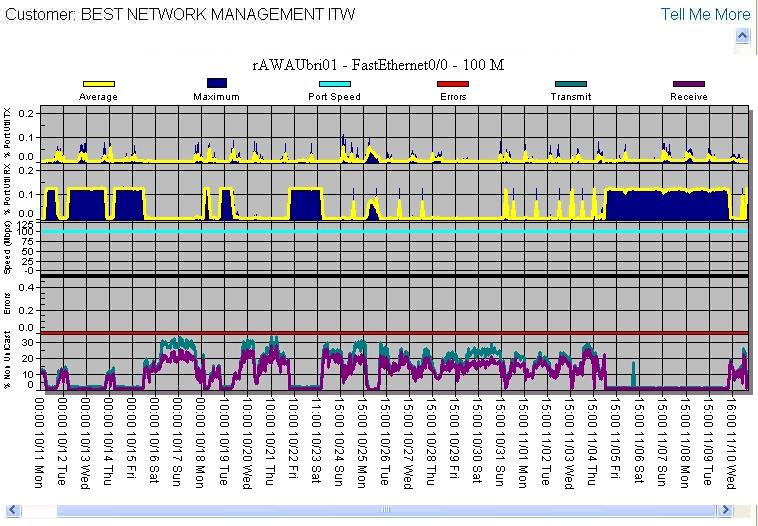
The Traffic Analysis report combines the most highly-used statistics about your network traffic flowing across your device's interfaces. This report can be used to cross-reference traffic patterns with errors and discards, and it shows trends in your data traffic performance.
Available statistics include:
Percent utilization
Percent non-unicast traffic
Port speed
Octets
FECN/BECNs
Packets
In/Out errors
Errors
Discards
These statistics are available for any managed interface on a device we manage.
Report Example:

To run a Traffic Analysis report:
Select the Reports tab.
From the Available Reports categories, select Analysis > Traffic Analysis Report
From the network tree, select and click the appropriate device.
Select an interface.
By clicking on the drop-down calendars and selecting a date or by typing over the text in the date fields, enter the primary graph date range for the report.
Check the check box for each report option you want to include.
Click Graph.
NOTE: You will see a message screen that shows the time until the report results
are complete. To exit the results page and send the report to the Stored Reports
page for later viewing, click Send to Stored Reports.
When viewing the report, you will see a graph containing information matching the options you selected.
For information on different ways to display and/or print report output, see Report Options.
Related topics: