
The information and functions in Exchange are arranged by topic and type across the following three major navigational areas:
The left navigation area of the display window is the Network Tree. This navigational aid arranges your network by geographical location and gives you the option to drill-down into more levels of detail. The information shown is customized based on your network.
The filters at the top of the Network Tree are:
Device Status - Use to define your view to include only devices in a certain status or state, such as All Devices or Failed Devices. (The default is All Active Devices.)
Show Product - Use to define your view to include specific product types, such as WAN, LAN, Security, or Server.
NOTE: The colors of the icon's parts in the tree indicate the state of the associated network elements.
Green - Functioning properly
Red - Failure has occurred
Different combinations of the two colors reveal the varying severity of any network problems and apply to the main navigation tree, the Service Request tree, and all selection trees for device-level reports:
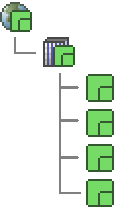
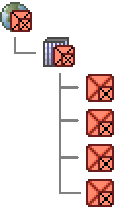
Location Icons - The location icons represent a Customer, Country, State, or City. Based on a parent-child relationship, the outer icon represents the parent, and the inner icon represents all the children of that parent. The parent icon color is determined by the best state of all the children icon. For example, if any child of a parent is green, the parent is green, otherwise, the parent is red. The child icon color is determined by the worst state of all of the children in that parent-child path (hierarchy). For example, if any child device below the parent is red, the child icon color is red, otherwise, the child icon is green.
Site Icons - Site icons are based on the same parent-child relationship as the location icons, and the color feedback of the icons works the same way.
Device Icons - Like the location icons, devices are represented with an inner and outer icon. If all the elements of a device are in alarm, the device icon is solid red (both inner and outer icon). If some but not all elements of a device are in alarm, then only the inner icons will be red, and the device icon will be partially red. Otherwise, the device is solid green (both the inner and outer icon).
Site Icon Examples


All Good All Fail Failed Element
NOTE: As well as having a color change from green to red, failed devices are represented by an "X."
The Expand All button opens every branch within the Network Tree. The Collapse button resets the tree to the prior state, or the highest-level collapses to the level you are at. Clicking the + or - boxes on the tree expands or collapses single branches of the tree.
NOTE: Sometimes the quantity of data being accessed when expanding the network tree can cause performance issues. To prevent performance issues, Exchange reacts in the following ways:
Monitors user log-in information and does not display the Expand All and Collapse buttons in cases where your data would exceed set limits. The buttons will be shown if the tree is filtered to a point (via the Device Status and/or Show Product) where the quantity of data does not exceed the pre-defined limit.
Limits your ability to expand all tree branches simultaneously by collapsing branches as you expand the tree
Select items in the Network Tree by left-clicking the element. Left-clicking the icon or name opens the Network Detail tab for that element. Right-clicking shows a pop-up menu for Reports that includes options for several report types.
Located above the Network Tree Filters section is the Search Trouble Tickets control. This control provides you with a convenient path to quickly see a specific trouble ticket if you know the open trouble ticket number (ID).
To search for an open trouble ticket by ticket number:
Enter the trouble ticket number, and click Search Trouble Tickets.
The trouble ticket details appear in the Network Details > Trouble Tickets sub-tab pane.
The menu bar consists of four options. These options are:
NOTE: This action will reset the Remember Me option.
The majority of Exchange content appears in the right pane and uses a tab structure to enable access to specific information.
The following list provides a description of tabs and sub-tabs:
Home - Consists of the following sub-tabs:
Details - Is the initial entry point that enables you to review the status of your network based on open trouble tickets, scheduled Install activities, news from Network Operations, and information regarding Exchange
Dashboard - Provides you a breakdown of tickets affecting your infrastructure's health that can be filtered by a product or a combination of all products and provides trending information about reliability and security risks
My Settings - Enables you to set preferences such as account information, time zone and ticket auto-close interval (with proper permissions) as well as ActiveMap display preferences such as by tickets or by alarms. (Ticket auto-close interval only appears for Admin users.)
Network Details - Consists of the following sub-tabs:
Trouble Tickets - Shows you a list of open trouble tickets associated with a selected tree element
Alarms - Shows you a list of active alarms associated with a selected tree element
Work Tickets - Shows you a list of open work tickets
Inventory - Shows you a list of devices associated with the selected tree element
Reports - Acts as a starting point for defining the information to include in a report
Support - Consists of the following sub-tabs:
Problems and Requests - Provides you the ability to report a problem. Also enables you to create a request for service that you can send immediately or save and send later. When submitting several requests, you may submit them individually or as part of a group.
Account and Feedback - Provides you with contact information for your account team, with a way to contact and send feedback to a specific department, and with invoice information. (Site group information appears for Admin users.)
Searches - Enables you to define the information you use to conduct a search
Active Map - Serves as a geographical representation of your network with a series of dots representing your sites and lines representing the connections between your sites
Admin - (Administrator Only) Consists of the following sub-tabs:
User Accounts - Provides you a way to see and/or edit profiles
Related topics: